


VIET NAM EXPORT–IMPORT STATISTICS 2025


16/03/2026
In 2025, Viet Nam’s total export–imxport value reached USD 930.07 billion, up 18.2% (an increase of USD 143.14 billion year-on-year). Of this, imports were USD 455.01 billion, up 19.4% (+USD 74.02 billion) while exports were USD 475.06 billion, up 17% (+USD 69.12 billion).
I. Viet Nam Exports 2025
1. Top 10 export markets of Viet Nam in 2024–2025
In 2025, Viet Nam’s total export turnover reached USD 475.04 billion, an increase of 17% compared with 2024. Six major markets – the United States, the EU, China, ASEAN, South Korea and Japan – accounted for more than 80% of total export value.
1. Top 10 export markets of Viet Nam in 2024–2025
In 2025, Viet Nam’s total export turnover reached USD 475.04 billion, an increase of 17% compared with 2024. Six major markets – the United States, the EU, China, ASEAN, South Korea and Japan – accounted for more than 80% of total export value.
.png)
Top 10 export commodity groups of Viet Nam 2024–2025
- United States: USD 153.18 billion, accounting for nearly 32% of total exports
- China: USD 70.45 billion
- EU: about 12–13% of total exports; EVFTA helps reduce tariffs
- South Korea: USD 28.94 billion
- Japan: USD 26.77 billion
- Hong Kong: USD 17.56 billion (+40% vs. 2024)
- Netherlands, India, Germany, United Kingdom: each market recorded USD 8–13 billion
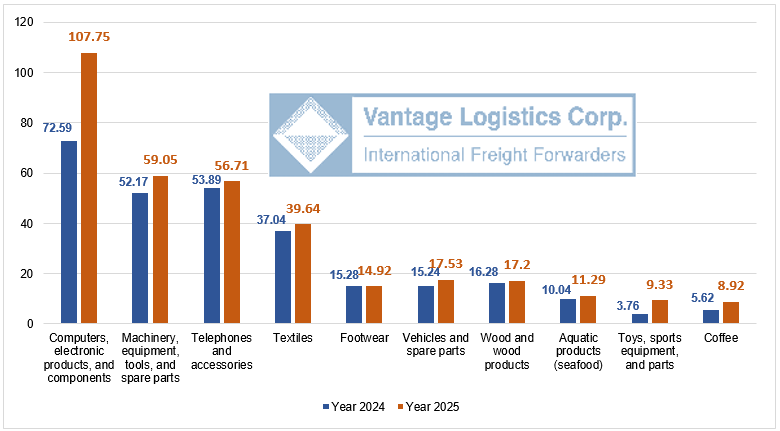
Top 10 export commodity groups of Viet Nam 2024–2025
- Computers, electronic products and components: approximately USD 107.75 billion (+48.4% compared with 2024), accounting for 23% of total exports
- Phones and components: approximately USD 56.71 billion, equivalent to 13%
- Machinery, equipment and spare parts: approximately USD 59.05 billion, accounting for 12%
- Other sectors include textiles and garments, footwear, wood products, seafood, coffee and transport equipment
II. Viet Nam Imports 2025
1. Top 10 Import markets of Viet Nam 2024–2025
Viet Nam’s total import turnover in 2025 reached USD 455.01 billion, an increase of 19.4% compared with 2024. Most imported goods consist of components, machinery and production materials, reflecting a typical trade model: import components → manufacture in Viet Nam → export finished products.
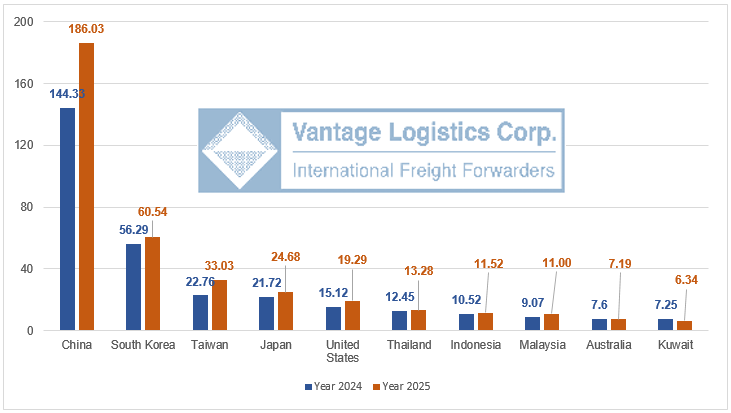
Top 10 largest import markets of Viet Nam 2024–2025
China remained Viet Nam’s largest trading partner, accounting for nearly 40% of total import turnover. South Korea maintained second place with around 12%, while Japan accounted for about 5%.
Other regional markets such as Taiwan, Singapore, Thailand, Malaysia and Indonesia also contributed to diversifying import sources, although their shares remain relatively modest. In addition, partners such as the United States and Germany, despite lower shares, continue to play a supplementary role in the import structure.
Other regional markets such as Taiwan, Singapore, Thailand, Malaysia and Indonesia also contributed to diversifying import sources, although their shares remain relatively modest. In addition, partners such as the United States and Germany, despite lower shares, continue to play a supplementary role in the import structure.
2. Major import commodity groups
Viet Nam’s imports in 2025 continued to grow strongly compared with 2024, reflecting strong demand for production inputs supporting manufacturing, processing industries and exports.
Almost all major imported goods consist of raw materials, components and equipment for production.
- Computers, electronic products and components: approximately 33% (USD 150.7 billion, +40.7%), leading due to FDI-driven demand (USD 106 billion)
- Machinery, equipment, tools and spare parts: 13% (USD 61 billion, +24.8%), reaching a record level to support industrial production
- Textile and footwear materials (fabric, cotton, fibres): approximately 6% (USD 28.3 billion, +2.3%)
- Fuel (petroleum USD 6.8 billion within a total fuel value of USD 23.3 billion): approximately 5% (value decreased 9.3% despite volume rising 2.8%)
- Iron and steel and related products: approximately 4% (USD 19.5 billion, +2.3%)
- Base metals and products: approximately 3–4% (USD 16.2 billion, +27%)
.png)
Top 10 import commodity groups of Viet Nam 2024–2025
The two groups electronics and components and machinery and equipment account for a dominant share, while input materials such as plastics, metals, fuel and fabric serve as production inputs for major export sectors including electronics, textiles and industrial processing.
This structure reflects Viet Nam’s growth model, which relies heavily on manufacturing and assembly within global supply chains.
III. Trends and Challenges
- High FDI share: more than 70% of exports come from FDI enterprises, reflecting dependence on foreign capital and technology.
- Positive structural shift: from raw agricultural products to processed goods, and from low-value products to high-technology sectors.
- Challenges: dependence on Asian supply sources, making supply chains vulnerable to disruptions and trade tensions.
- Opportunities: free trade agreements (EVFTA, CPTPP, RCEP) expand markets and reduce import costs for production materials.
IV. Viet Nam’s Trade Supply Chain
The export–import structure shows a clear model:
- Raw materials and components are imported from industrial hubs in Asia
- Manufacturing and assembly take place in domestic industrial zones
- Finished goods are exported to major consumer markets such as the United States and the EU
Contact Vantage Logistics for consultation on international transport and logistics solutions to optimise supply chains for export–import businesses.