


VIET NAM LEADS SOUTHEAST ASIA’S TRADE SURGE IN Q1/2026


07/04/2026
In the first quarter of 2026, Viet Nam’s total export-import turnover reached a record $249.50 billion, a 23% increase compared to the same period last year. Despite a trade deficit of $3.64 billion, this shift signals robust preparation in production materials for the upcoming quarters.
1. ASEAN Trade Performance Q1/2026
ASEAN economies entered 2026 with a positive recovery momentum, but at markedly different levels.
2. Overview of Viet Nam's Trade in Q1/2026
According to the General Statistics Office (GSO) – Ministry of Planning and Investment, Viet Nam’s total merchandise export–import turnover in the first three months of 2026 was estimated at USD 249.50 billion, up 23% compared to the same period in 2025.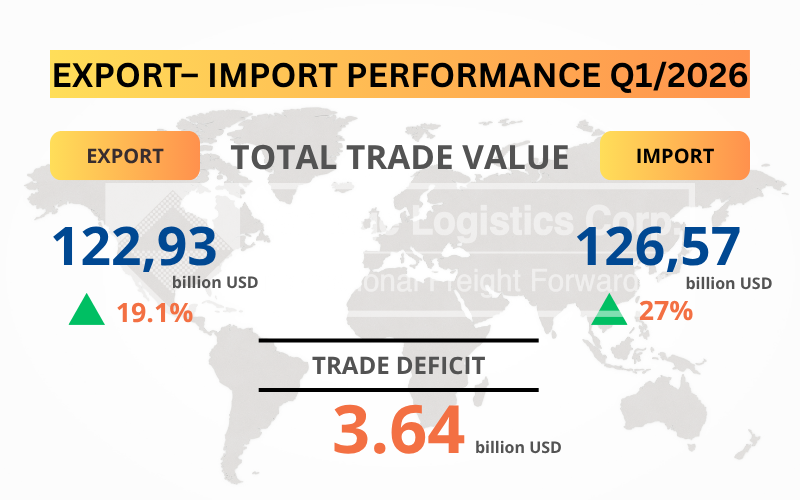
Key Export Commodities:
Export Markets: The United States remains Viet Nam's largest export partner with a turnover of $39.0 billion. While achieving a significant trade surplus of $33.9 billion (+24.2%), Viet Nam faces potential pressure regarding tariff policies from this market in the following quarters.
2.2 Import Structure by Commodity Groups
Import turnover reached $126.57 billion, up 27% year-on-year. The FDI sector imported $91.37 billion (+45.3%), reflecting a surge in demand for raw materials and machinery for export production. The domestic sector imported $35.2 billion, down 4.3%.
There were 22 commodity groups that exceeded the $1 billion import threshold, accounting for 82.8% of total turnover. Notably, just two of these groups surpassed the $5 billion mark, contributing a significant 49.8% to the total import value. This indicates that Viet Nam's production inputs currently rely heavily on a concentrated selection of key components and raw materials.
The import structure clearly reflects a production-oriented strategy:
Import Markets: China remains the largest import partner with a turnover of $50.1 billion and a trade deficit of $33.3 billion (+34.4%). This reflects a continued reliance on northern supply chains for materials and components, highlighting the need for long-term supply chain diversification.
3. Trade Balance and Logistics Indicators
In Q1/2026, Viet Nam recorded a trade deficit of $3.64 billion, a reversal from the $3.57 billion surplus in the same period of 2025.
This deficit is primarily attributed to the FDI sector's accelerated import of components and raw materials to fulfil major export orders scheduled for Q2 and Q3. This trend reflects a strong recovery in production demand rather than a decline in competitiveness.
Alongside merchandise trade, service exports achieved positive results at $9.1 billion (+19.2%). Notably, transportation services reached $2.65 billion (+29.3%) – a promising signal and a significant contribution from the logistics industry to the national economy.
Data Source: General Statistics Office (GSO) – Q1/2026.
Go Back
| Economy | Period | Export Growth (YoY) | Import Growth (YoY) | Trade Balance | Highlights |
| Viet Nam | Q1/2026 | +19,1% | +27,0% | –3.64 bn USD deficit | FDI-driven electronics, rising deficit with China |
| Thailand | Jan–Feb/26 | +24.4% (Jan) | +30,5% | –6,14 billion USD deficit | Phones +195%, largest deficit in 13 years |
| Malaysia | Jan–Feb/26 | +19.6% (Jan) | +5.3% (Jan) | +38.67 billion MYR surplus | Record-high surplus, E&E 47.3% of exports |
| Singapore | Jan–Feb/26 | +30,4% (Jan) | +16,6% | Surplus | Non-oil re-exports +51.4%, continued growth in Feb |
| Philippines | Jan–Feb/26 | +8,3% | –3,1% | Deficit | Highest exports since 1991, electronics 56.5% |
| Indonesia | Jan–Feb/26 | +3,4% (Jan) | +18.2% (Jan) | +2.23 bn USD surplus | 70th consecutive surplus, imports of capital goods rising |
| Campuchia | Q1/2026 | +17,7% | +16,7% | –741 million USD deficit | Strongest Q1 ever, boosted by RCEP & FTAs |
| Brunei | Jan/2026 | –6,1% | –4,8% | +467.9 million BND surplus | LNG & crude oil dominate, decline due to lower energy prices |
| Lào | N/A | N/A | N/A | Surplus projected | Electricity exports (39%), copper, gold, maize |
| Myanmar | N/A | Sharp decline | Imports restricted | Deficit likely | Trade at ~46% of pre-2021 level, sanctions & instability |
| Timor-Leste | N/A | N/A | N/A | N/A | N/A |
ASEAN economies entered 2026 with a positive recovery momentum, but at markedly different levels.
- Leaders in growth: Vietnam (+23% total trade), Singapore (+30.4% exports), Malaysia (record surplus).
- Deficit pressures: Thailand, Cambodia, Viet Nam.
- Electronics as growth driver: Malaysia, Singapore, Vietnam, Philippines.
- Smaller economies: Brunei, Laos, Myanmar, Timor-Leste operate at smaller scale but remain strategically important in energy and transport corridors.
2. Overview of Viet Nam's Trade in Q1/2026
According to the General Statistics Office (GSO) – Ministry of Planning and Investment, Viet Nam’s total merchandise export–import turnover in the first three months of 2026 was estimated at USD 249.50 billion, up 23% compared to the same period in 2025.
2.1 Export Structure by Commodity Groups
Total export turnover reached $122.93 billion, up 19.1% year-on-year. The Foreign Direct Investment (FDI) sector remained the primary driver, contributing $98.46 billion (80.1% of total), a sharp increase of 33.3%. Meanwhile, the domestic economic sector recorded $24.47 billion (19.9%), a decrease of 16.6% due to shifts in local supply chains.
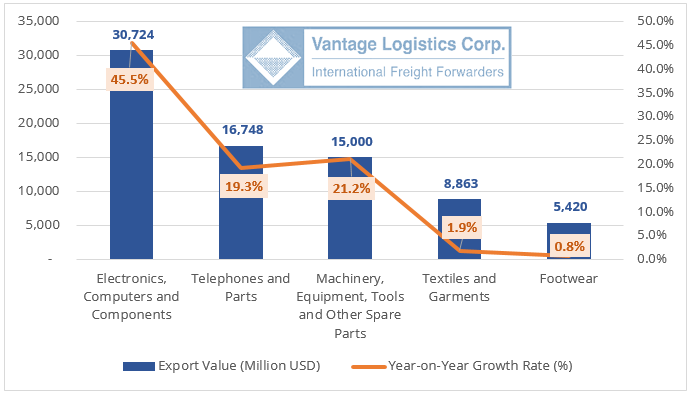
The export structure shows the absolute dominance of the manufacturing and processing industry. In Q1/2026, 20 commodity groups exceeded the $1 billion threshold, accounting for 86.8% of total exports. Notably, the top 5 groups (each exceeding $5 billion) contributed 62.4% of the total export value.
Total export turnover reached $122.93 billion, up 19.1% year-on-year. The Foreign Direct Investment (FDI) sector remained the primary driver, contributing $98.46 billion (80.1% of total), a sharp increase of 33.3%. Meanwhile, the domestic economic sector recorded $24.47 billion (19.9%), a decrease of 16.6% due to shifts in local supply chains.
The export structure shows the absolute dominance of the manufacturing and processing industry. In Q1/2026, 20 commodity groups exceeded the $1 billion threshold, accounting for 86.8% of total exports. Notably, the top 5 groups (each exceeding $5 billion) contributed 62.4% of the total export value.
Key Export Commodities:
- Technology groups: Electronics, computers, and components maintained the top position with an impressive 45.5% growth. This result reflects the recovery in global demand and the strategic shift of AI equipment and semiconductor supply chains to Viet Nam. Phones and components followed with a turnover of $16.74 billion (+19.3%).
- Traditional sectors: Textiles and Footwear recorded modest growth of 1.9% and 0.8% respectively. This indicates increasing competition from lower-cost markets and growing pressure from sustainability standards in key export markets.
Export Markets: The United States remains Viet Nam's largest export partner with a turnover of $39.0 billion. While achieving a significant trade surplus of $33.9 billion (+24.2%), Viet Nam faces potential pressure regarding tariff policies from this market in the following quarters.
2.2 Import Structure by Commodity Groups
Import turnover reached $126.57 billion, up 27% year-on-year. The FDI sector imported $91.37 billion (+45.3%), reflecting a surge in demand for raw materials and machinery for export production. The domestic sector imported $35.2 billion, down 4.3%.
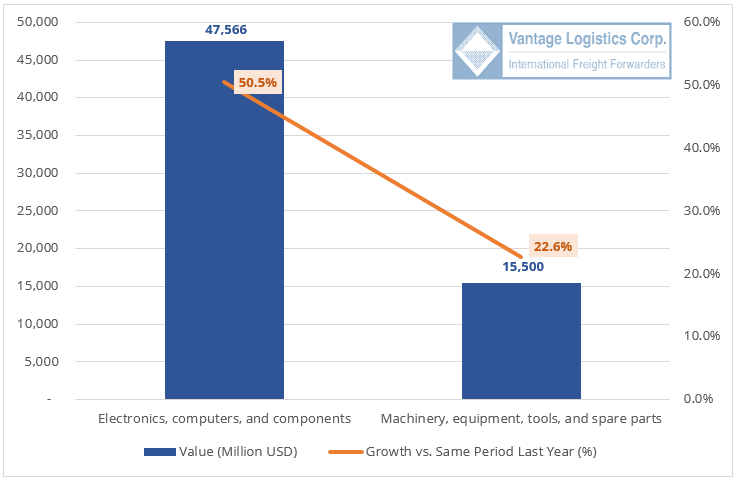
There were 22 commodity groups that exceeded the $1 billion import threshold, accounting for 82.8% of total turnover. Notably, just two of these groups surpassed the $5 billion mark, contributing a significant 49.8% to the total import value. This indicates that Viet Nam's production inputs currently rely heavily on a concentrated selection of key components and raw materials.
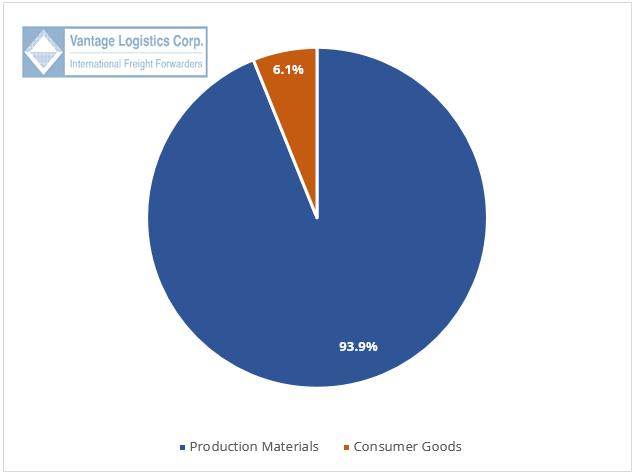
The import structure clearly reflects a production-oriented strategy:
- Production Materials: Reached $118.84 billion, accounting for an absolute share of 93.9%.
- Machinery, equipment, and tools: Accounted for 55.3%, reflecting a strong wave of technological investment and factory expansion.
- Raw materials and fuels: Accounted for 38.6%, ensuring the supply for processing and manufacturing activities.
- Consumer Goods: Represented only a small fraction at $7.73 billion (6.1%), indicating effective management of foreign consumer goods to prioritise foreign currency for industrial development.
3. Trade Balance and Logistics Indicators
In Q1/2026, Viet Nam recorded a trade deficit of $3.64 billion, a reversal from the $3.57 billion surplus in the same period of 2025.
This deficit is primarily attributed to the FDI sector's accelerated import of components and raw materials to fulfil major export orders scheduled for Q2 and Q3. This trend reflects a strong recovery in production demand rather than a decline in competitiveness.
Alongside merchandise trade, service exports achieved positive results at $9.1 billion (+19.2%). Notably, transportation services reached $2.65 billion (+29.3%) – a promising signal and a significant contribution from the logistics industry to the national economy.
Data Source: General Statistics Office (GSO) – Q1/2026.